Semi-automated FDC for Semiconductor Manufacturing Processes
 Semi-automated feature extraction and FDC for Semiconductor Manufacturing Processes
Feature-based univariate analysis (UVA) is the primary method for process monitoring and fault detection (FD) in today’s microelectronics manufacturing facilities. However, FD fails to use process variables correlations to detect fault and quality issues. Multivariate analysis (MVA) captures the correlation between different parameters in process; however, current MVA techniques such as principal component analysis (PCA), partial least squares (PLS), and their variants focus on threshold setting based on the principal or independent components extracted from the raw data, which practically cannot provide a direct limit setting on raw parameters for decision making support during online process monitoring. Also, in bypassing feature identification and extraction, the subject matter expert (SME) is largely left out of the loop because particular features can often be associated with particular fault types. Furthermore, it is difficult to visualize the multivariate limits due to the high dimensionality of the data produced in semiconductor manufacturing processes. Finally, slow and normal process changes often occur in real processes, which can lead to false alarms during implementation when using models trained from offline samples. There is a need for an FD technique that (1) leverages the existing base of feature-based UVA, (2) provides a mechanism to determine correlation among parameters, (3) provides a mechanism to understand and as necessary reject normal process drift, (4) provides for automatic calculation of limits UVA features that captures correlation among parameters, and (5) provides a method for simple viewing of these capabilities so that the subject matter expert (SME) can visualize, understand, and continue to contribute to the FD optimization process.
In this work, we propose a systematic adaptive limit setting and visualization method for FD in semiconductor manufacturing processes that addresses the above 5 requirements. The proposed method has been shown effective when applied to a public dataset and datasets generated by our trace simulation tool.
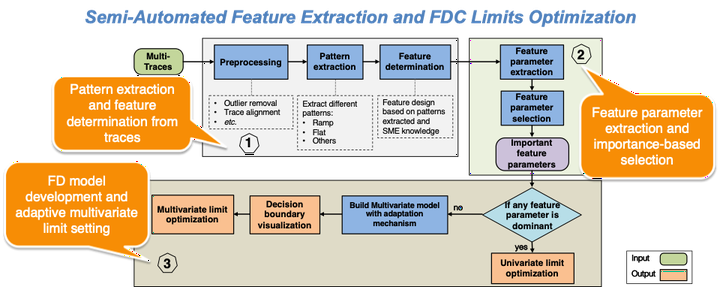
A high-level overview of the proposed methodology is described in Fig. 1, which mainly includes three major steps: Step 1 - Pattern extraction and feature determination from traces: A set of trace data from wafer runs is used to learn the patterns and determine the features contained in the traces. Different patterns in the traces are detected by our pattern extraction algorithm. The trace segmentation techniques in this step further improve on the initial achievements that have been presented at the 28th, 29th, and 30th APC conferences [2][3][4]. Within each trace segment, expert knowledge is leveraged to finalize the feature set of interest. For example, the patterns such as ramp and flat are recognized by the pattern extraction processing. Either every single pattern or the combination of different contingent patterns will be taken as features of interest for further analysis.
Step 2 - Feature parameter extraction and selection: The major task of Step 2 is to determine the distribution of parameters that describe the features determined in Step 1 and select the important parameters. The statistical parameters are mainly used to summarize the important information in the recognized trace patterns. For example, the slope, length, width, and height are extracted to depict a ramp feature; the analysis from Step 2 might determine the average of the slope for a feature across the provided data traces. In addition, the solution provides a method for an SME to be employed to depict and/or fine tune the properties of certain features.
After the feature parameter extraction is completed, the important features are selected based on criteria, such as receiver operating characteristic (ROC) curve analysis. This selection can occur in an unsupervised setting (like traditional FD where quality data is not directly tied to the trace data) or in a supervised setting where quality data, such as yield or fault classification data, is directly tied to the trace data.
Step 3 - FD model development and adaptive multivariate limit setting: Once the important feature parameters are selected, the FD model and corresponding multivariate limit setting mechanism are developed. In the analysis pipeline in Step 3, a check is performed first to find out if dominant feature parameters exist that fully differentiate faulty from healthy traces individually, which is equivalent to finding a suitable parameter for UVA. If no decisive parameters are found, multiple parameters are selected based on their importance ranking obtained in Step 2, and the multivariate FD model is established. To realize better visualization, understanding and decision-making (SME) integrated support, the multivariate limit determined by the FD model is projected and visualized in lower-dimensional views. In addition, considering the data drift in processes, the model adaptation mechanism is incorporated to address any data drift in processes and treat it as anomalous or normal (with this determination provided by the SME). The adaptation mechanism incorporates moving window, data filtering, and incremental modelling methods.
Jianshe Feng
PhD, Data Scientist
My research interests include Machine Learning, adaptive Prognostics and Health Management (PHM), and Industrial AI.